Artistic Background


"It is 2001. For years I have been carrying a compass like a watch, to orient myself on cloudy days. Without it I am lost. I also have a large, bulging box full of well-worn maps; my access to the world of cities, walking, cycling and skating trips. How often do I find myself out and about, peering at a flapping map and thinking: couldn't a red dot just appear at the spot where I am right now?

In the autumn of that year I am taken along on a sailing trip on the Lauwersmeer. My friends already have a GPS device. At the end of the day they show me a tiny screen displaying that day's journey. I am immediately captivated: I see not only the shape of the lake, but also the direction of the wind and our human need for breaks — two little knots in the drawing. A week later I am cycling through Amsterdam. My first mobile phone gives a ping: I stop to check an SMS. The city, the GPS drawing and the SMS click in my mind: the idea for AmsterdamREALTIME is born."

- Visual artist Esther Polak, 2025

"The neighbourhood where you live, a network of lines, small loops, shortcuts, hesitations, having forgotten something, walking the dog, letterbox, buying a paper, unexpected encounters, the local café, and the neighbourhood where you lived before, and the one before that, and the one before that, back to where it all began, home, the fine lines around it, to school, over the fence, around the corner, the neighbours' curtains, back routes, secret spots, and the route you take when you have time, zigzagging past shop windows, hand in pocket, along facades you had overlooked, a broken bicycle that has stood there for years, or the route towards someone, towards him or her, the way you go when you want to see each other, or the way you go when you'd rather not, along what detour, and the route to work, or from work back home, lines, stretched around corners and squares, knotted with the daily madness of rush hour, or a place where you find peace, under a tree or on a bench, somewhere along the water, on a terrace, under a bridge, and the routes you should really take but never do, the routes you once dreamed of or the routes you almost forget, all these routes together, a memory of streets, pavements, alleys and gaps left by demolished houses, like a nervous system, a fingerprint."

- Visual artist Jeroen Kee, 2002


↓ Interactive animation 2006
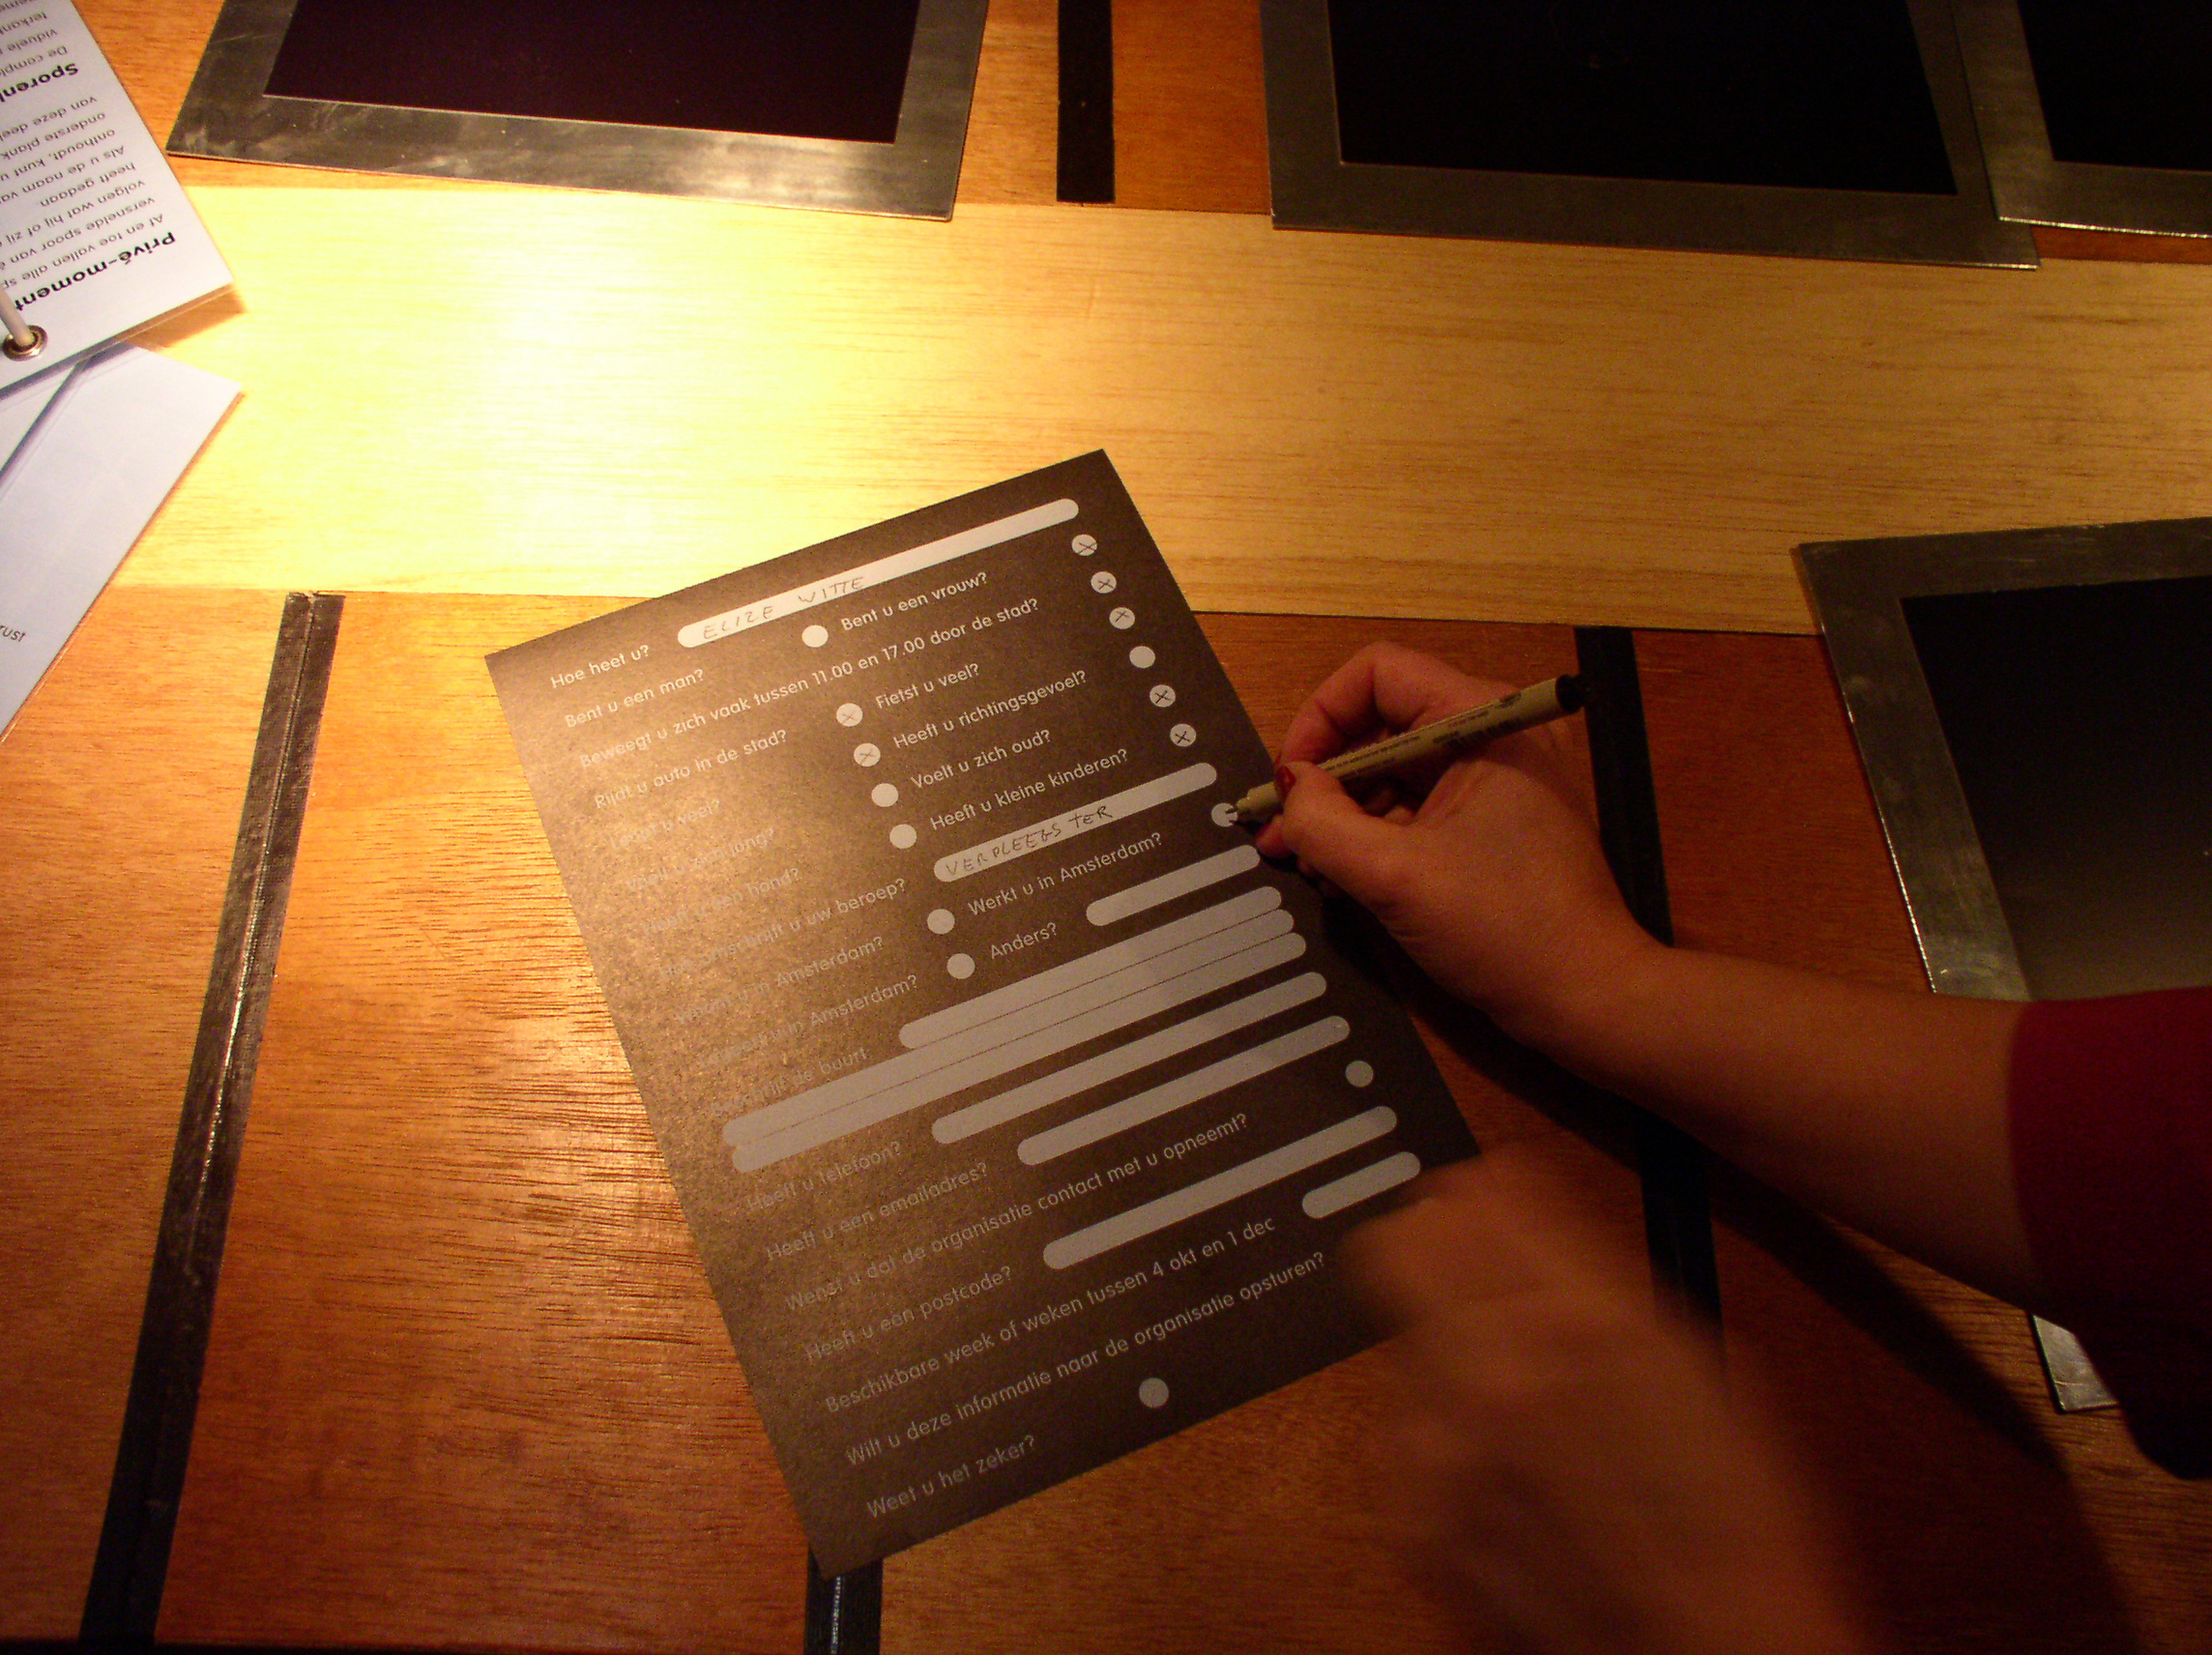
↓ Live performance 2002
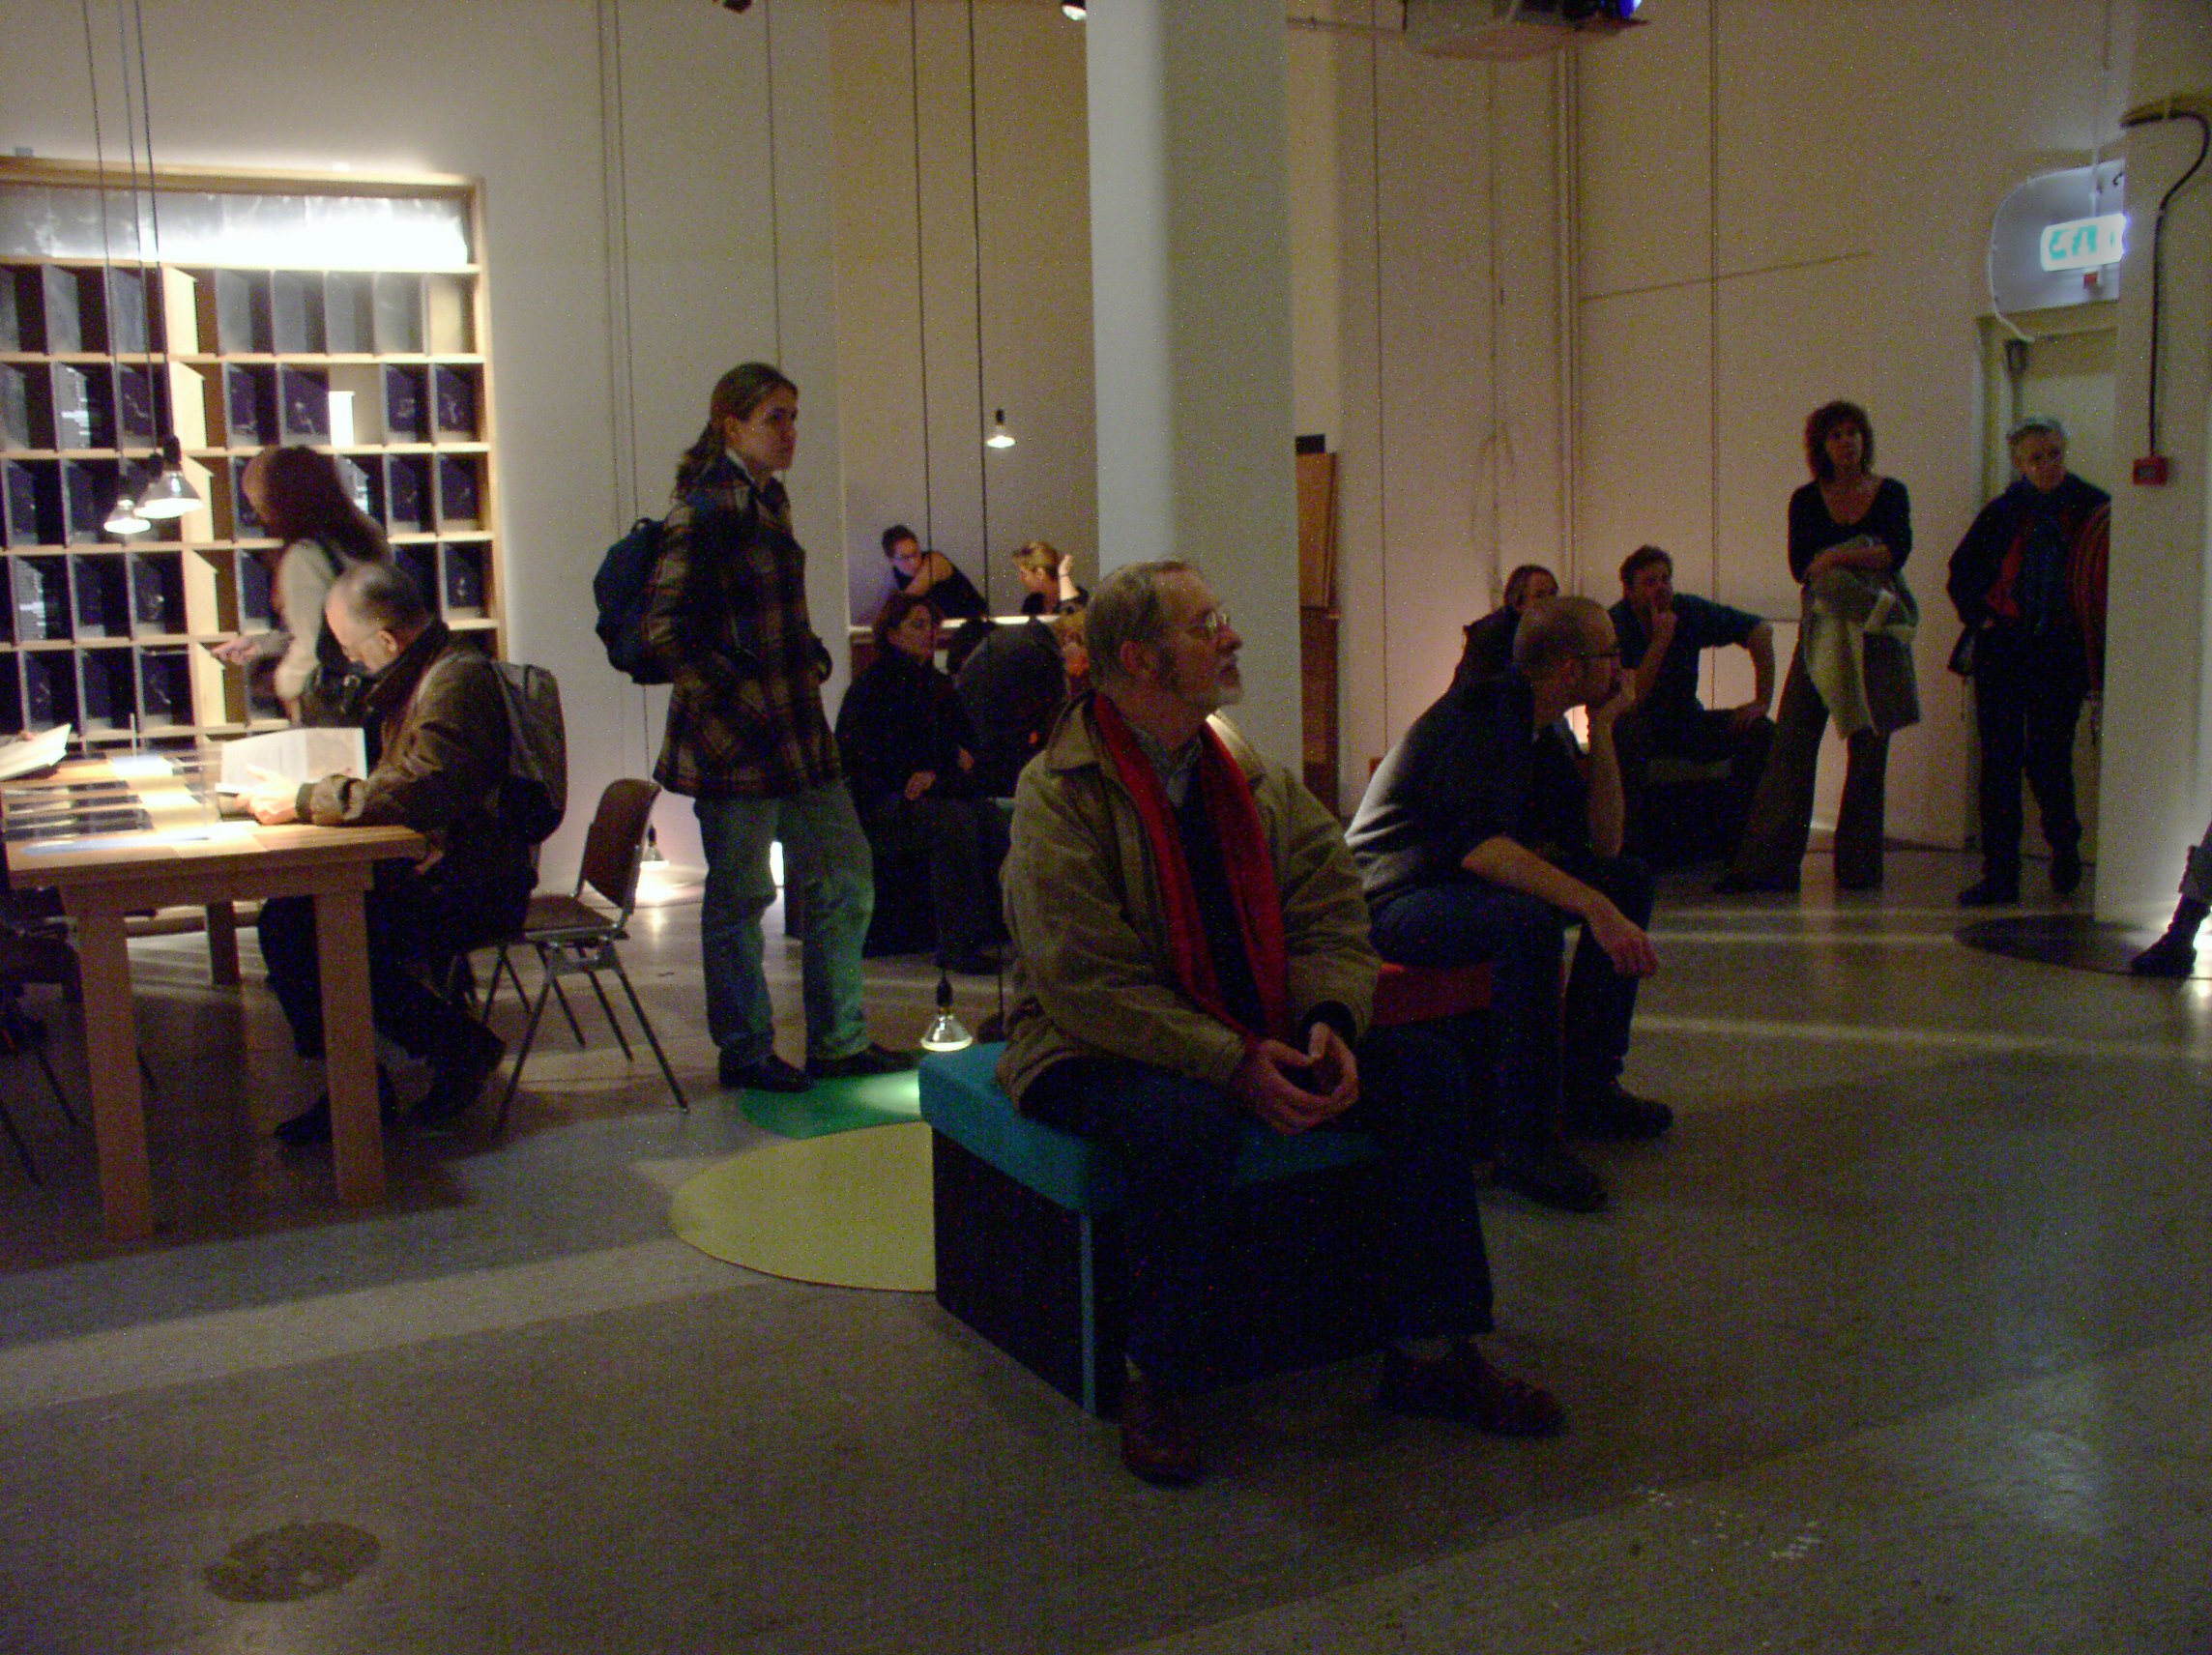
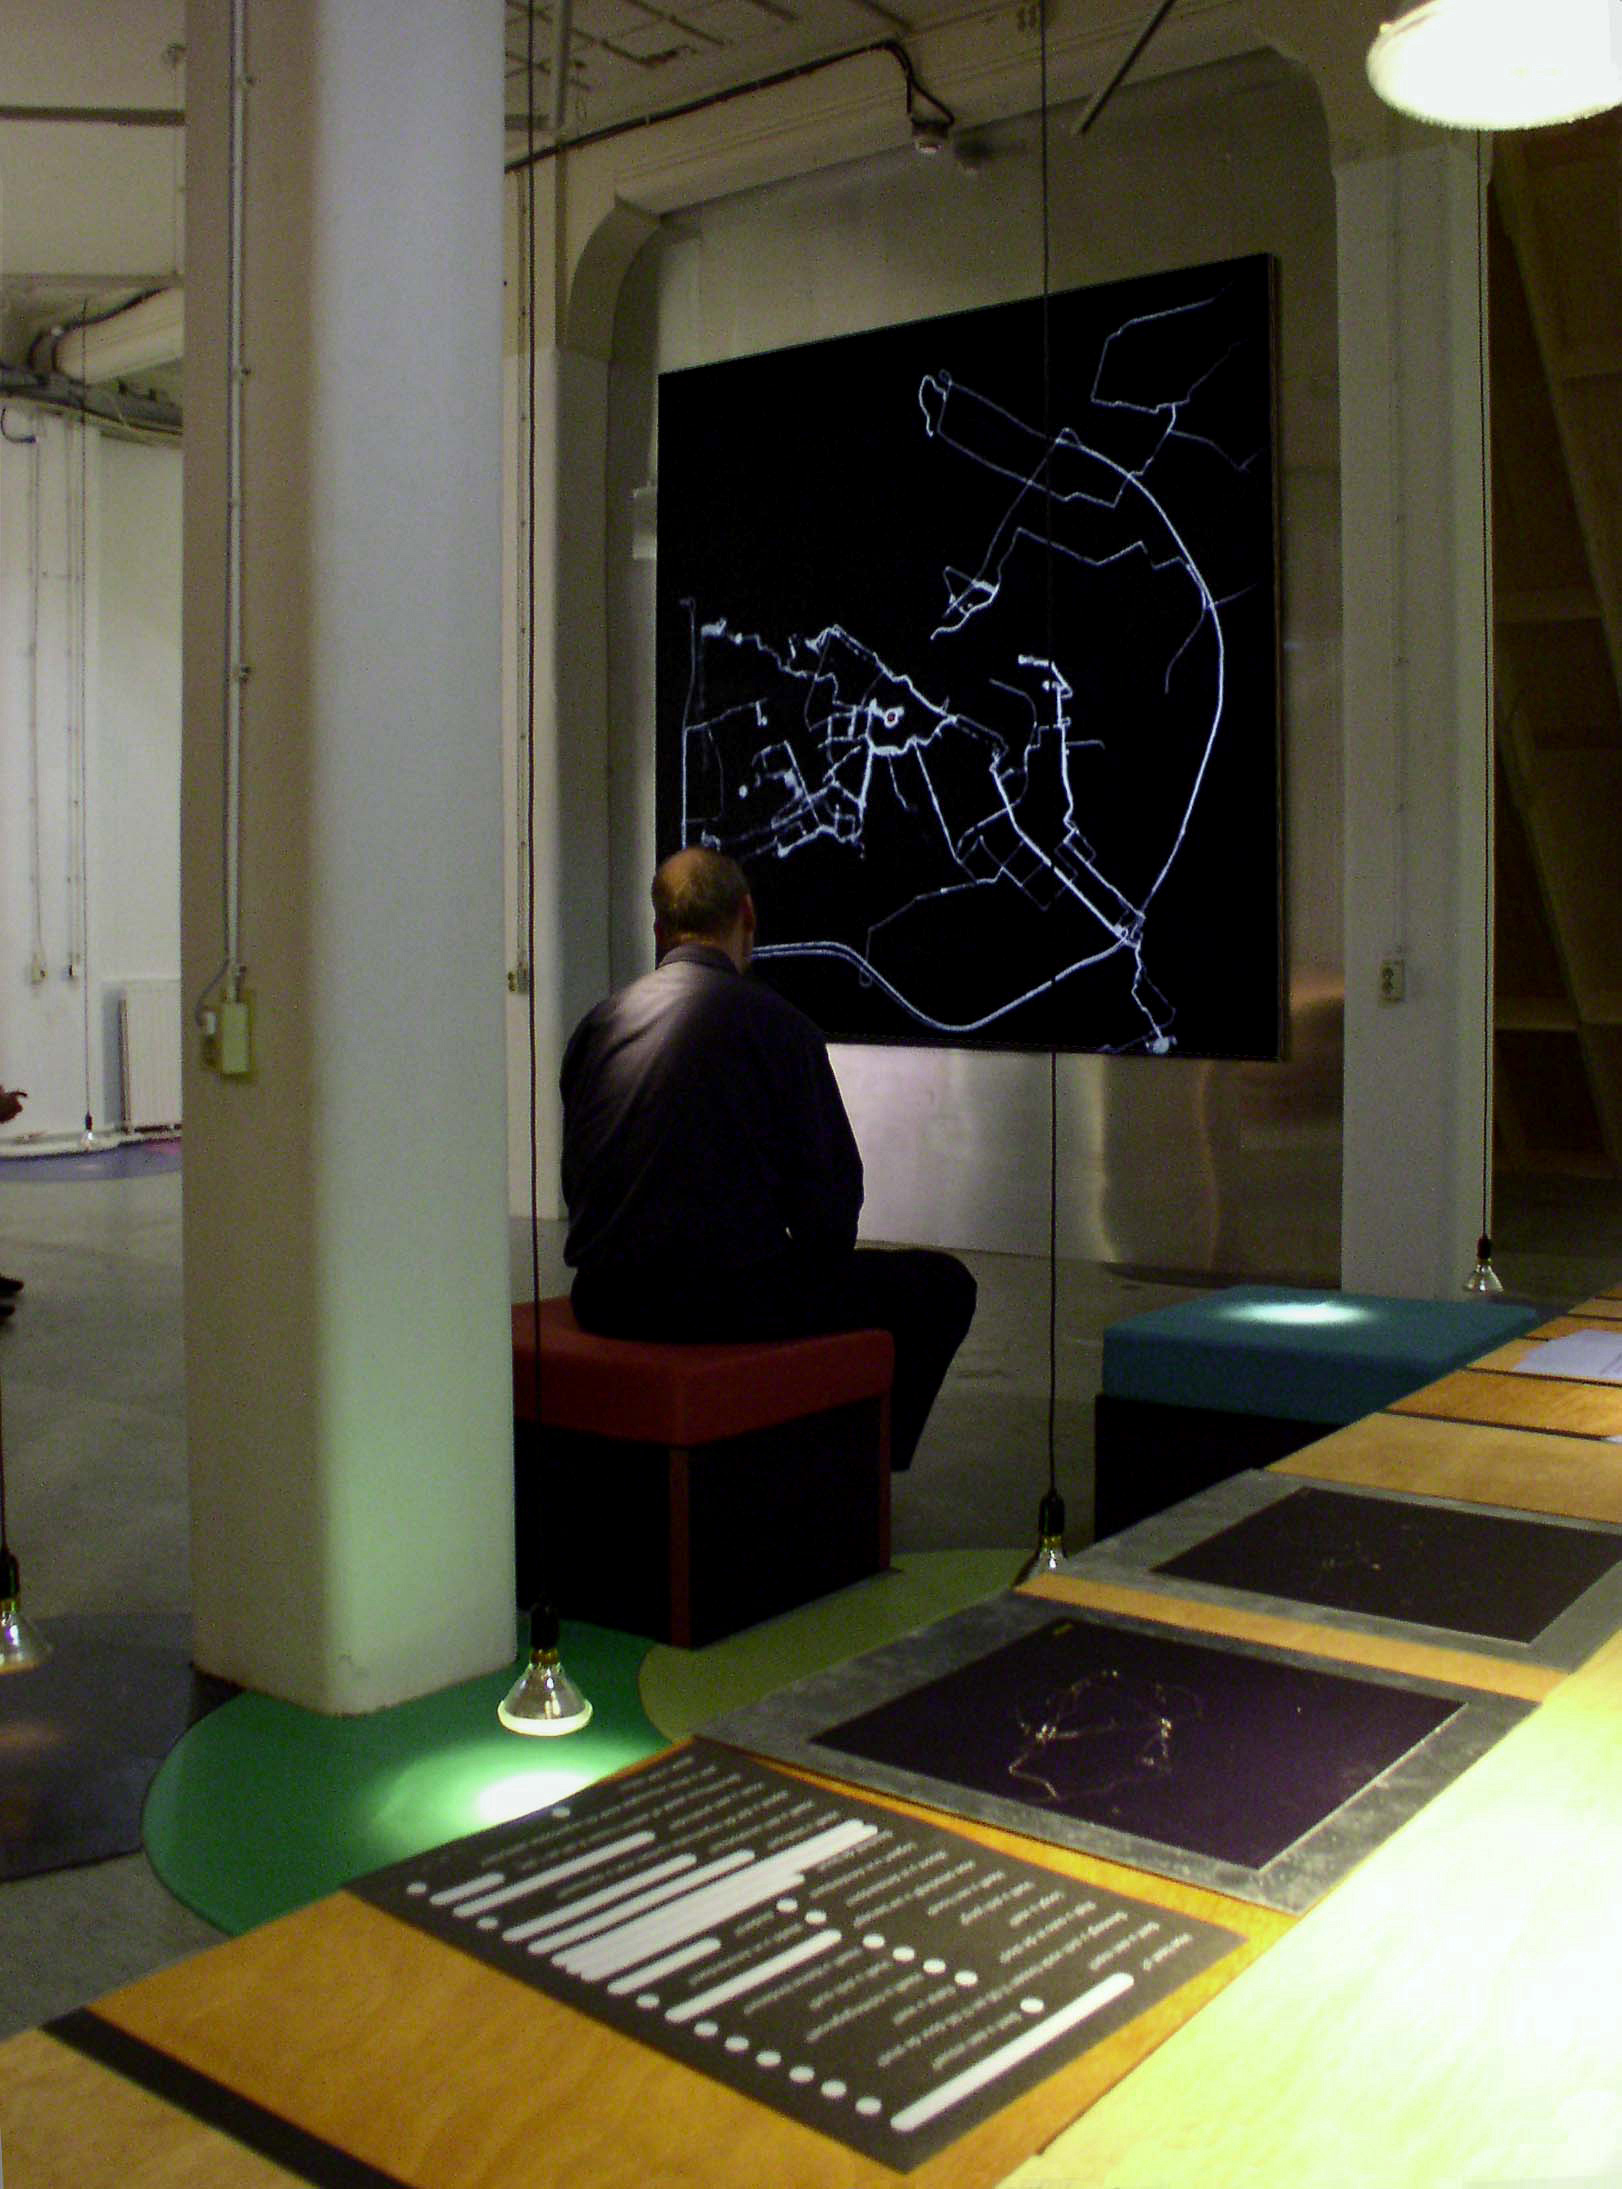
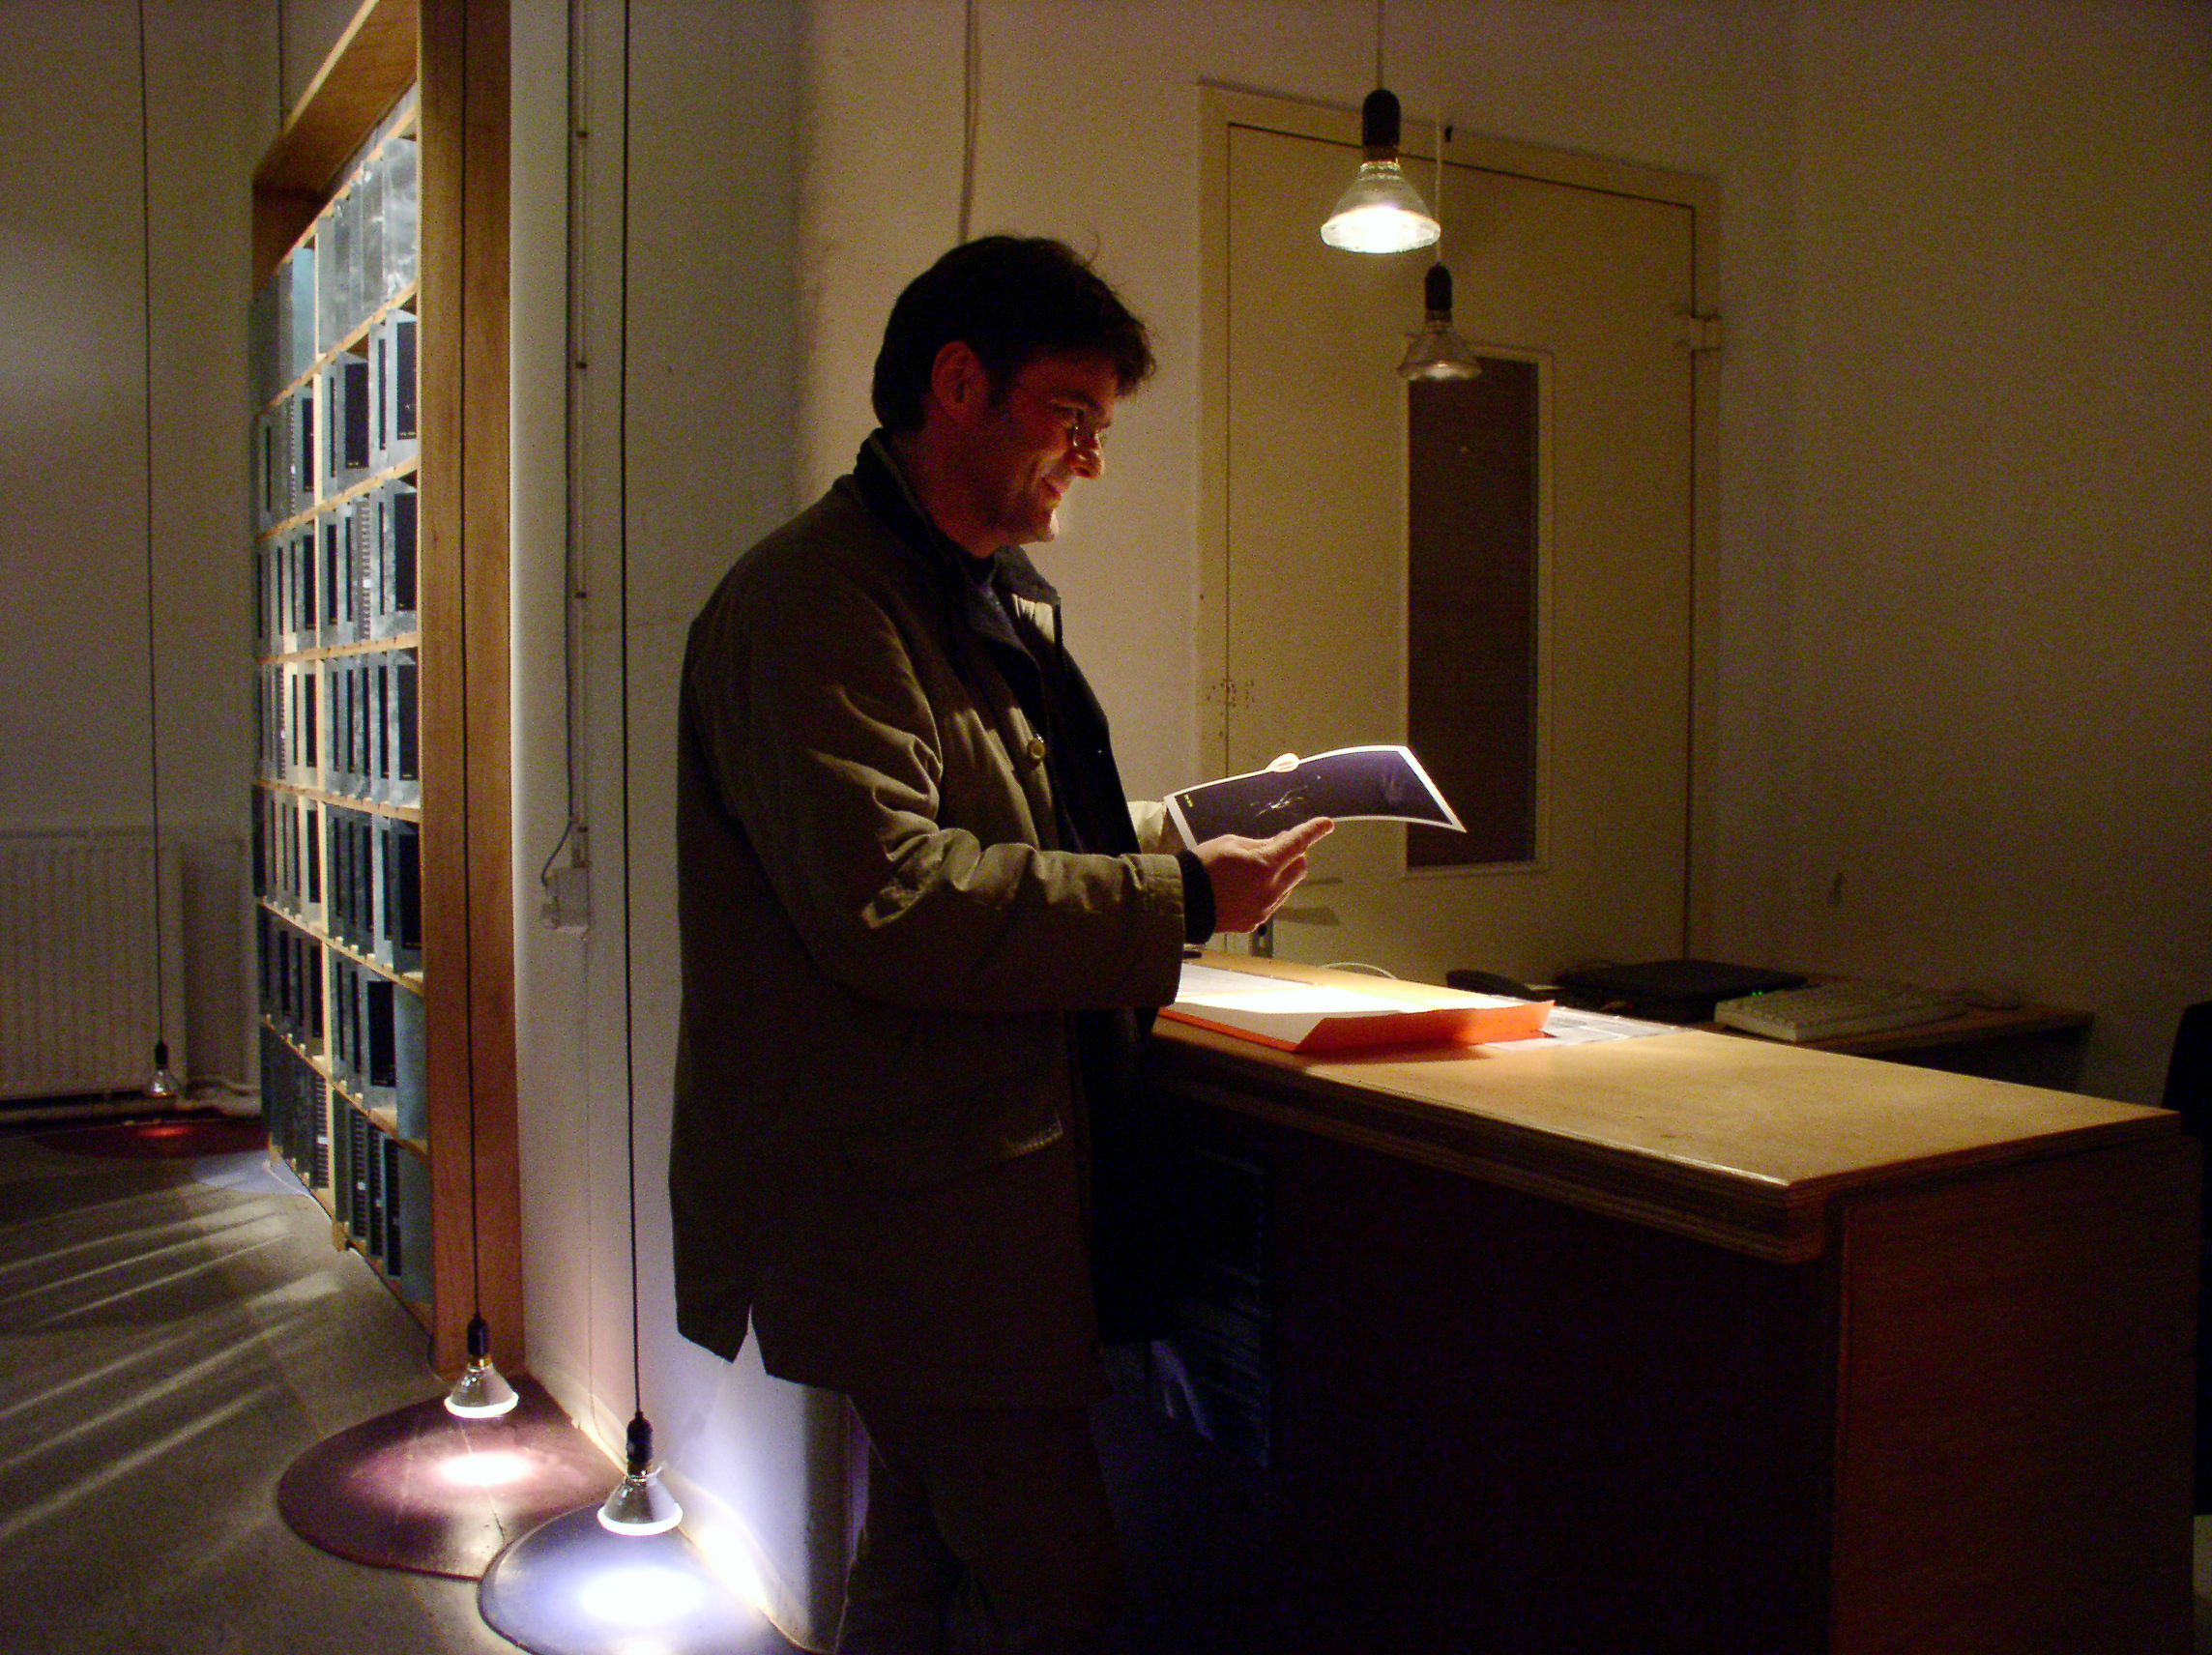
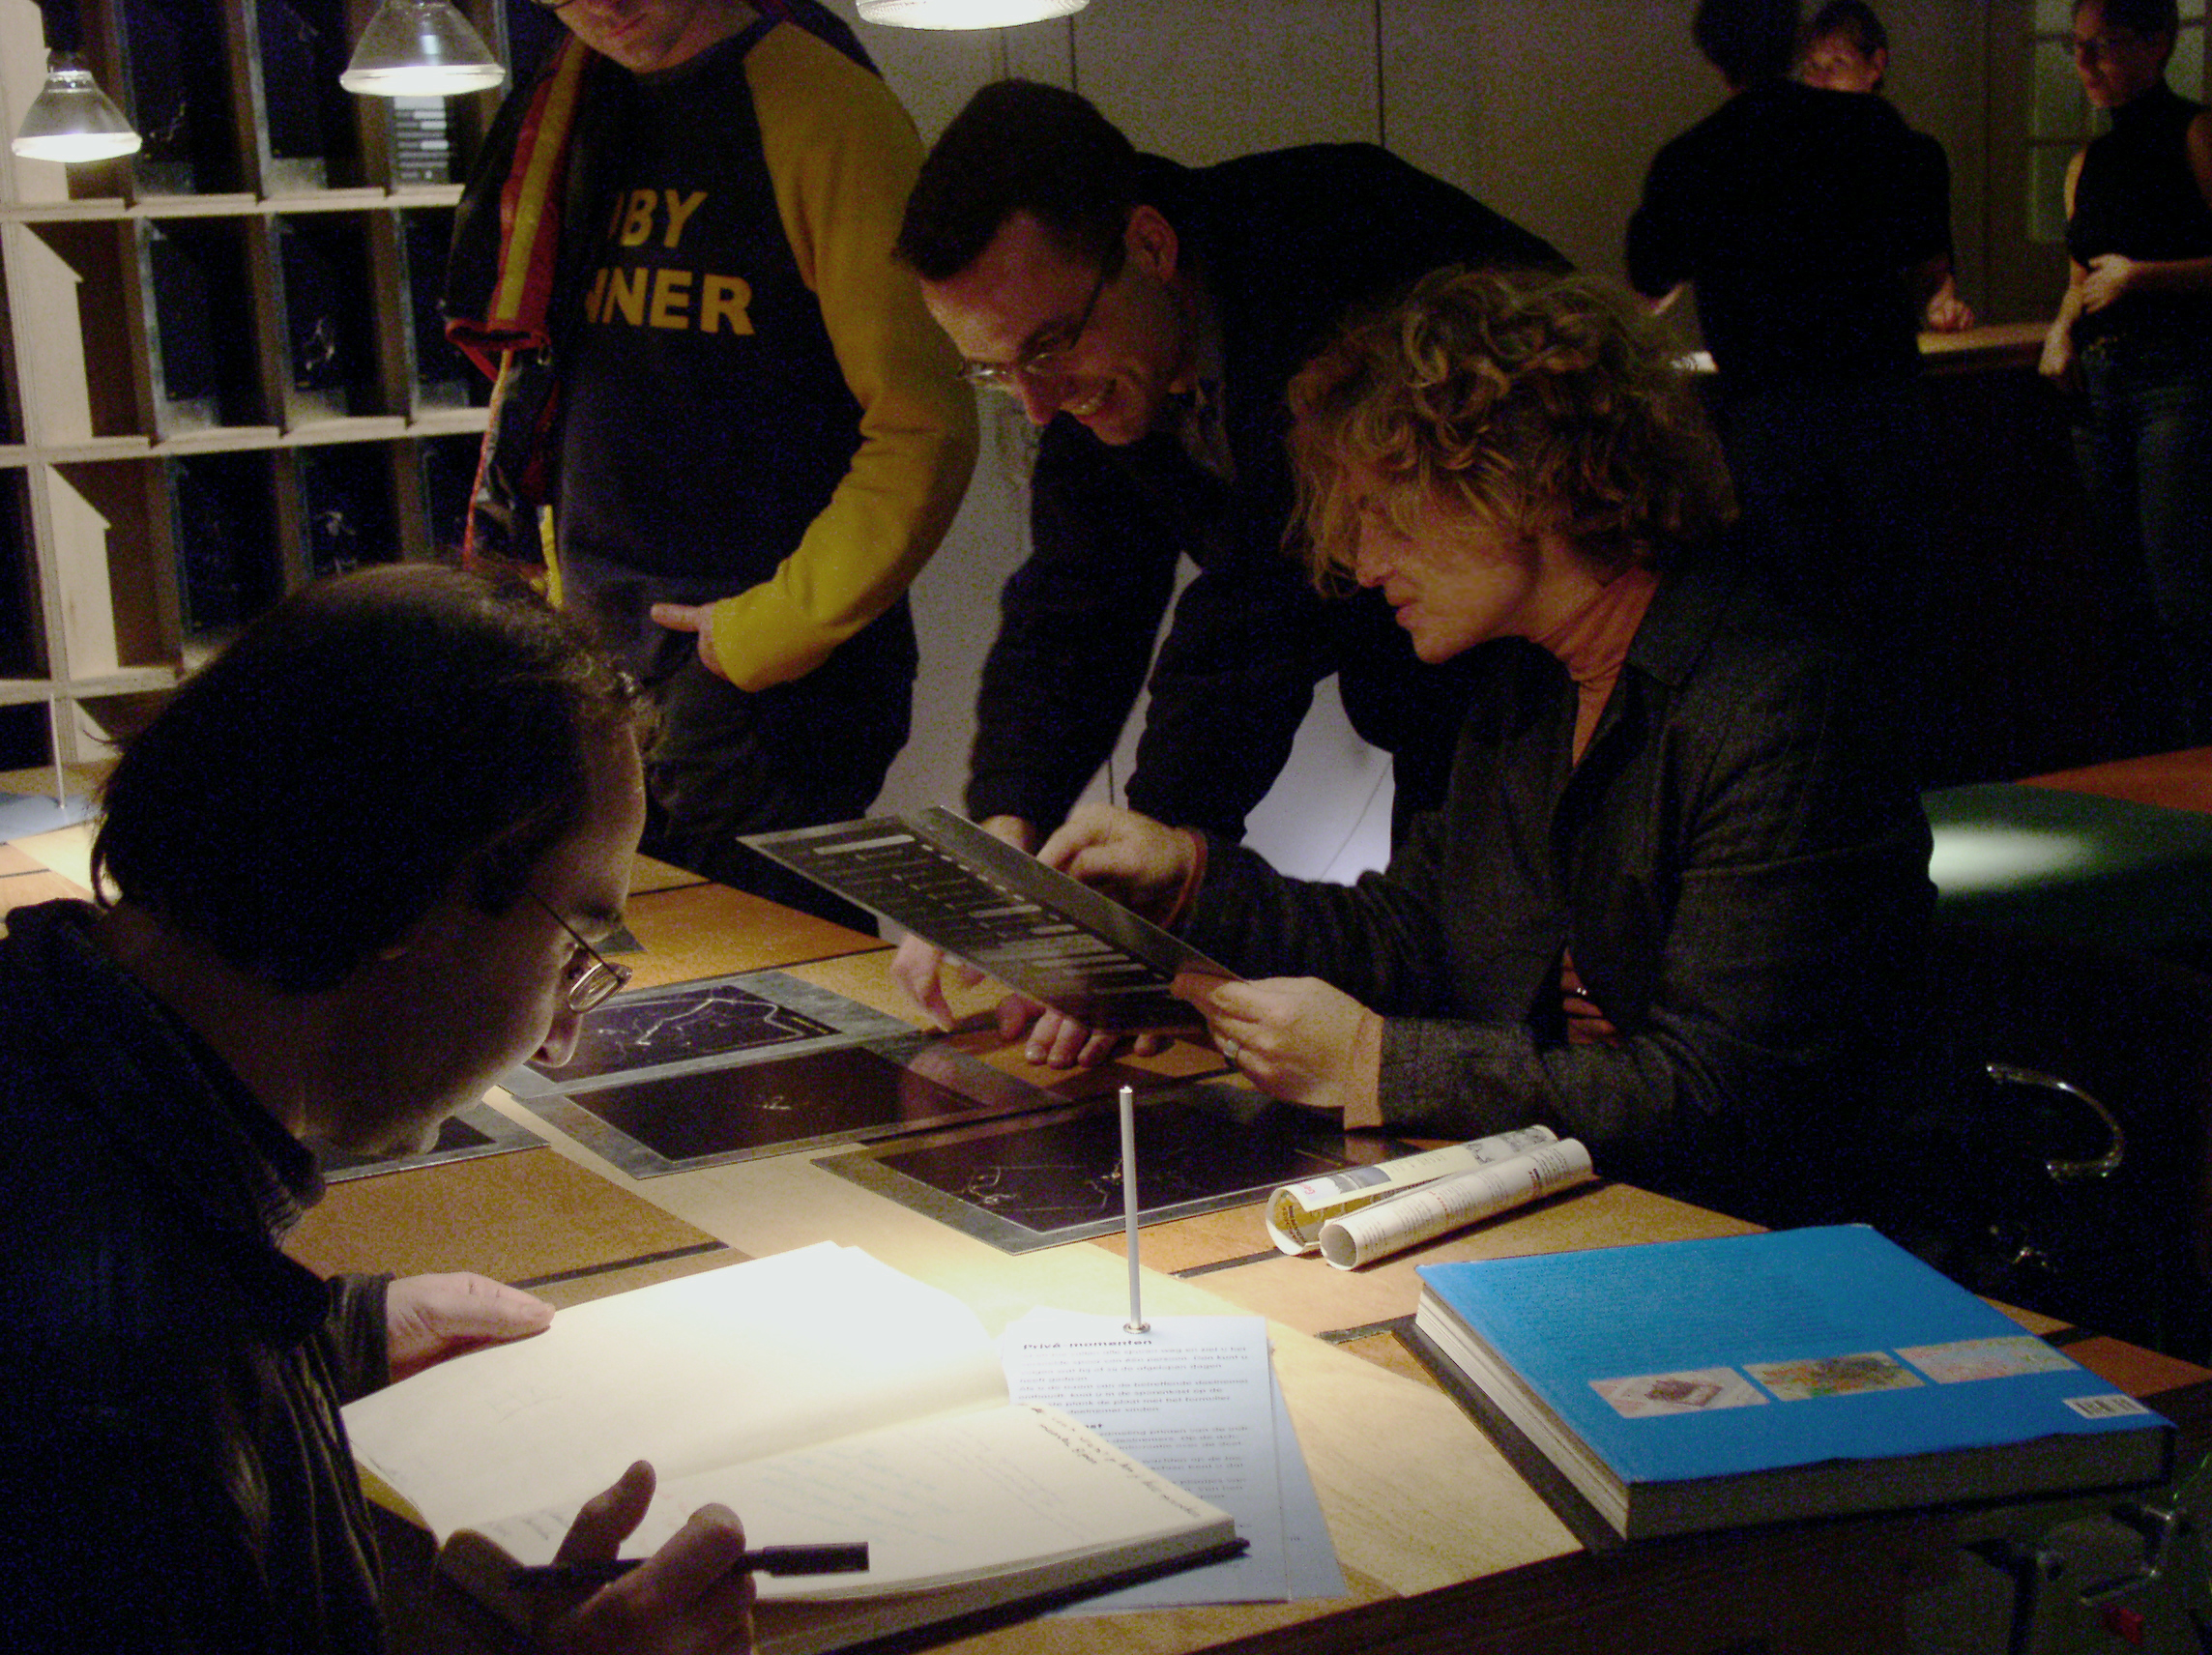
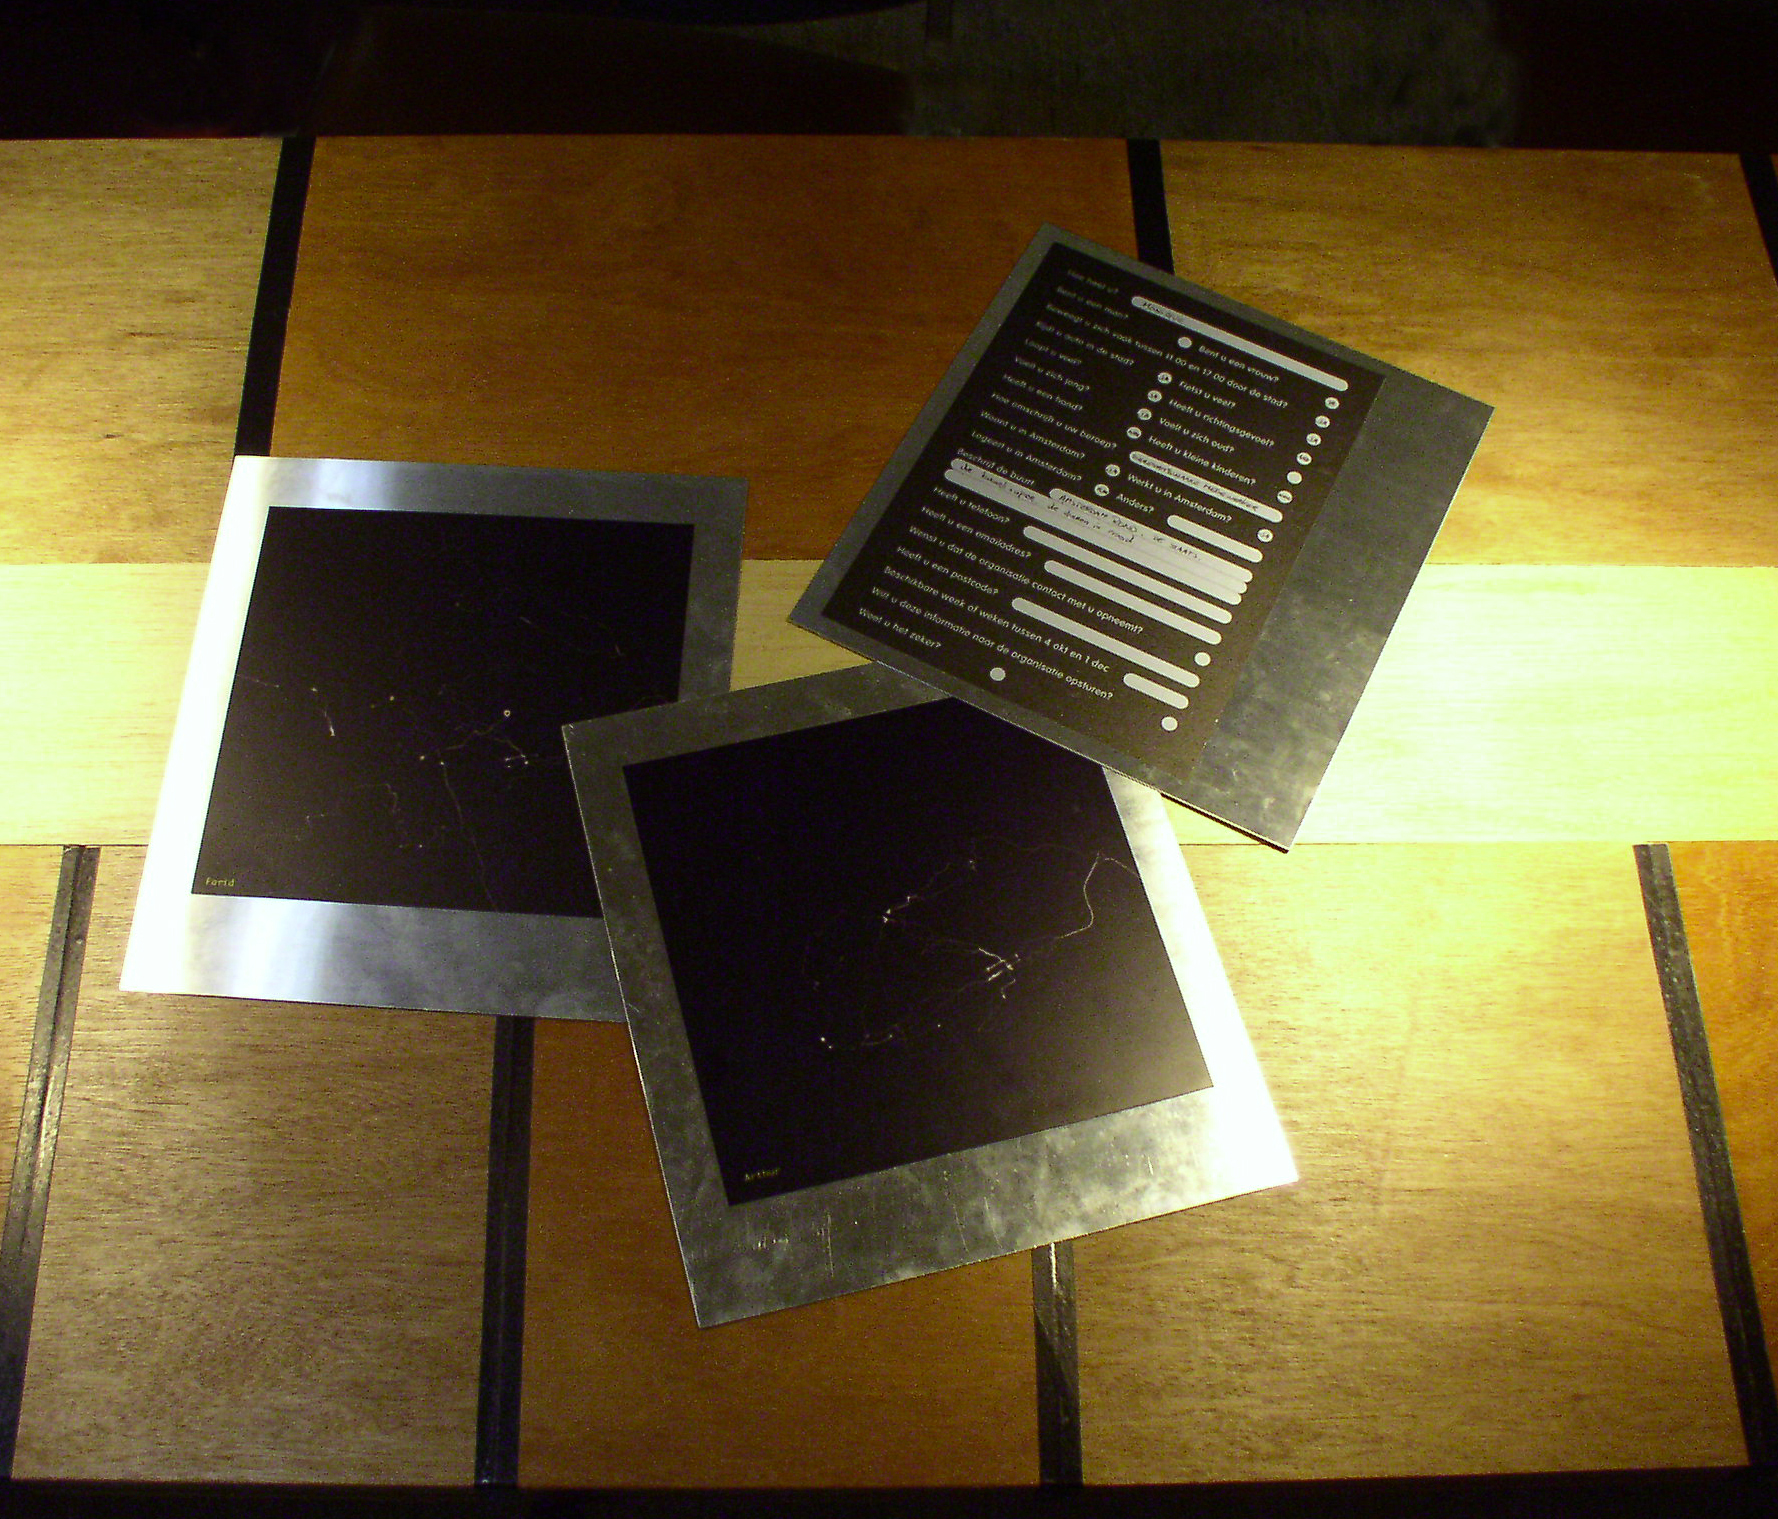
↓ Exhibition situation 2002

Interactive animation 2006

Our design of the 2006 animation re-expresses the core ideas of the 2002 live project through powerful visualisation. We portray the city as a democratic space, arising from the accumulation of routes made by individual citizens. Through the interaction, we give viewers the opportunity to choose for themselves between individual routes and the city as it emerges from the sum of multiple tracks.

In a subtle way, the animation makes the meaning and future of location and data technology tangible. The numerical coordinates of each participant scroll past on the left as a ticker, subtitled with some basic information about the individual. This hints at a future in which citizens increasingly become — whether voluntarily or not — data producers.

We retained the visual character of the lines from 2002: places on the map that are visited frequently gradually shift in colour from white to yellow to red. This makes the 'intensity of use' of routes and locations visible. Red burn marks appear here and there, when a tracer stays in the same spot for a long time. Even then, of course, GPS keeps recalculating the location. The line keeps shifting within small error margins, writing over itself, like a scratching needle.

The fact that GPS data reception — especially in narrower streets — is not always equally accurate is made visible by blurring the lines accordingly. Through these choices, the line drawing transcends the digital and also acquires a physical and graphic quality.

Live performance 2002

We invite all Amsterdammers to participate. A registration form appears in the Amsterdam newspaper Het Parool. Readers can fill it in, cut it out, and send it free of charge to the Municipal Archive. We distribute leaflets with the same form around the city and Amsterdammers can also register digitally via a simple html website.

We select from the many applications that come in based on neighbourhood diversity, gender, occupation and the mobility we expect. Participants are scheduled by week, and during that week they carry a specially developed tracer with them. There is just enough project budget to make ten tracers, so we have to plan carefully. The tracers are fitted into specially designed bags, but they remain, especially compared to a contemporary smartphone, quite experimental objects.

As soon as participants head out with their tracer, their location is transmitted in real time and appears in the exhibition space on a large projection as a dot with the participant's name. These dots leave a lively pattern of lines on a black surface (see visualisation). From this a dynamic map of Amsterdam emerges naturally — one that prioritises not streets or city blocks, but the movements of people.

How it all works still needs to be explained to visitors regularly in 2002: after all, the first GPS-equipped smartphone is still five years away. For both participants and visitors, in 2002 this is an unprecedented way to show and experience the city. (See technology)

The many conversations we have around the project — for example with participants returning their tracers — repeatedly reveal the intensely personal character of the routes. The mode of transport, the location of one's home, work or other activities, and the participant's own mental map all influence the trace. A cyclist has different favourite routes from a driver. For visitors to the exhibition it becomes a game to guess this.

After participants have returned their tracer, they receive a print of their own routes. These prints also find a place in a cabinet, which gradually fills up over the course of the project. We call this a 'diary in tracks'. On the looking back page you can hear the responses of former participants and others involved who — more than 24 years later — hold their print in their hands again.

Exhibition situation 2002

Visitors watching

It is 2002. Visitors enter the installation "AmsterdamREALTIME", which forms the closing piece of the exhibition 'Maps of Amsterdam 1886–2000'. Here they see in real time the traces appearing of participants currently out in the city.

29

Using infrared detection at the entrance, visitors trigger the system, causing one of the traces to be rapidly rebuilt from scratch on an empty map. The map then fills again with the accumulated traces, supplemented live by the currently active participants.

receiving a print

At the back of the space is the desk. Here visitors ask questions, register as a participant, bring or collect their tracer, and receive the print of their own route.

examining prints at the table

Visitors take prints of individual routes from the cabinet and study them at the reading table.

27

By filling in the form, visitors register to participate.

detail of table prints

Completed registration forms can be read (with permission from the relevant participant) on the back of the prints.